Services
Services Discovery
Tracking services in a modern environment creates layers of complexity that are difficult and time-consuming to manage, especially in a dynamic environment. Gremlin provides a complete, up-to-date view of your services along with their operational metadata. This includes port numbers, process names, and the number of active targets the service is running on. You can favorite services that are important to you and your team, or ignore services that are outside of your team’s purview. This way, you always have visibility into your most relevant services.
Services Discovery is another capability of our Gremlin agent. Our agent can be enabled to collect host, containers, and Kubernetes processes. Gremlin then collates this data across a team’s clients and into a new target type called a service.
Enabling Services Discovery
To use Services Discovery, the Gremlin agent must be configured to collect process data. This includes host-based processes, containers, and Kubernetes resources. Please see Enabling Services Discovery for more information.
Kubernetes-based services are discovered automatically, since the installation of the Gremlin Kubernetes client sets the necessary requirements upon install.
Host and container-based services may take up to one hour to display in Gremlin once process collection is configured on the agent.
Services collation
Services are collated approximately once an hour.
Viewing your list of services
Discovered services are displayed in the Services menu in the Gremlin web app. This is the main view of all your services collated across the Gremlin clients that have process collection enabled. Here you can mark a service as your favorite by clicking the star icon, or click into any service to view service details and attack the service.
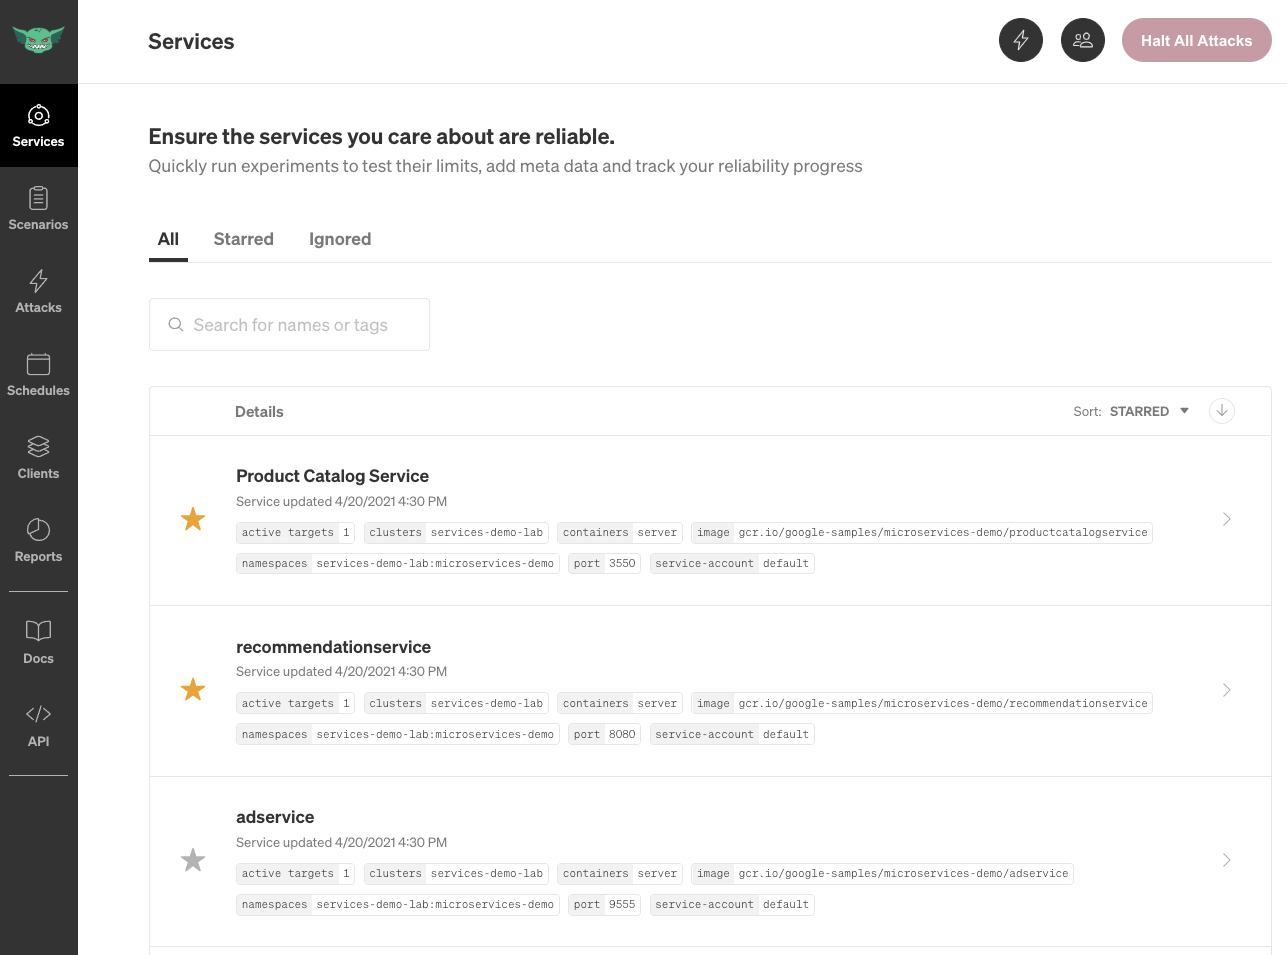
There are three tabs for viewing your services:
- All: List of all services, excluding ignored services.
- Starred: List of all starred services.
- Ignored: List of all ignored services.
In each view you can search by any service name or identified metadata tag. You can also sort and arrange by starred, name, and number of active targets.
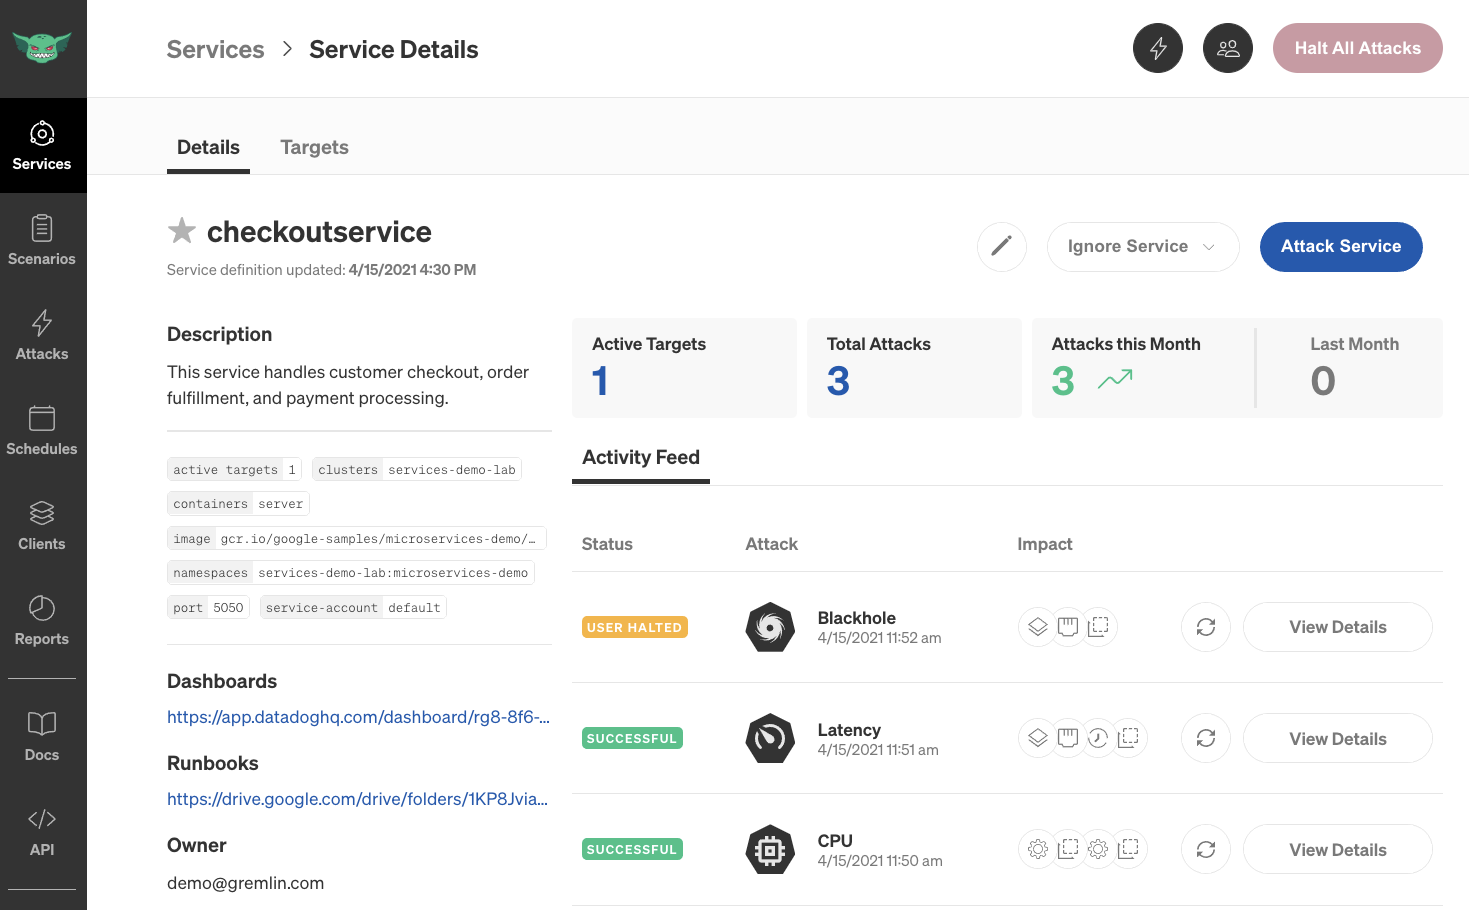
Viewing service details
The service details page is your service dashboard that you can use to manage each service. You can perform tasks such as starring a service to favorite it, ignore the service, attack the service, add a description explaining what the service does, assign an owner, and link directly to monitoring dashboards and incident response runbooks.
For each service, you can edit the following metadata fields:
- Name: The name of this service. By default, this is set to the service name identified by Gremlin.
- Description: A description of the service, so users understand what the service does and how it can be impacted.
- Dashboards: Links to your monitoring dashboards for the service, so that you can easily view the impact from the chaos experiments you run.
- Runbooks: Links to runbooks for incident response procedures.
- Owner: The user who owns this service. You can select other users on your Gremlin team.
Metadata
Various metadata is displayed for each service based on target type. This information helps you identify the service and fine-tune the blast radius for different attacks. Examples include:
- Host: Ports, executable, version
- Container: Ports, image, service
- Kubernetes: Cluster, namespace, ports, image, command, service account
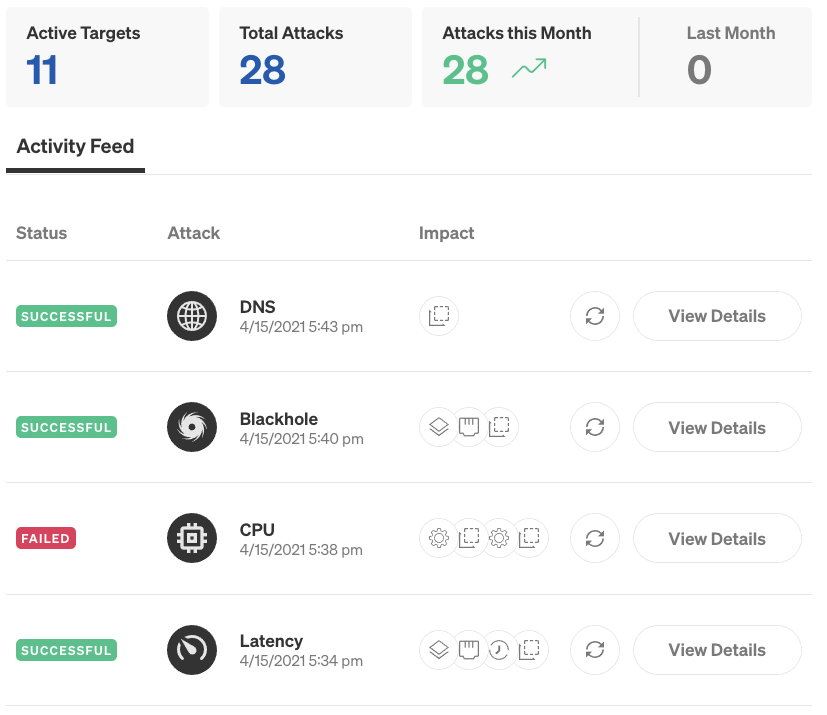
Targets
A target is a host, container, or Kubernetes resource where the Gremlin agent detected the service. Active targets of the service are shown, enabling visibility into each deployment of your application. This enables validation of blast radius of impact as well as the ability to attack each target individually.
Activity feed
The activity feed shows each attack run against a service. A user can see the attack type, impact, user who ran the attack, and have the ability to rerun the attack with the same configuration.
Gremlin records4 each attack to enable a user and team to keep track of total attacks and month over month statistics.
Ignoring a service
A service can be ignored from the Service Details page. When you click the Ignore Service button you can choose three reasons:
- I don't care about this service: This is a service I recognize but don't want to impact
- I don't recognize this service: This is a service I can't identify
- Other: Tell us why this service is not relevant to your team
The results of the selection will be displayed in the service metadata in the Ignored tab of the Services list view.
Attacking a service
There are multiple ways to run an attack on a service using Gremlin.
Attacking from the service details page
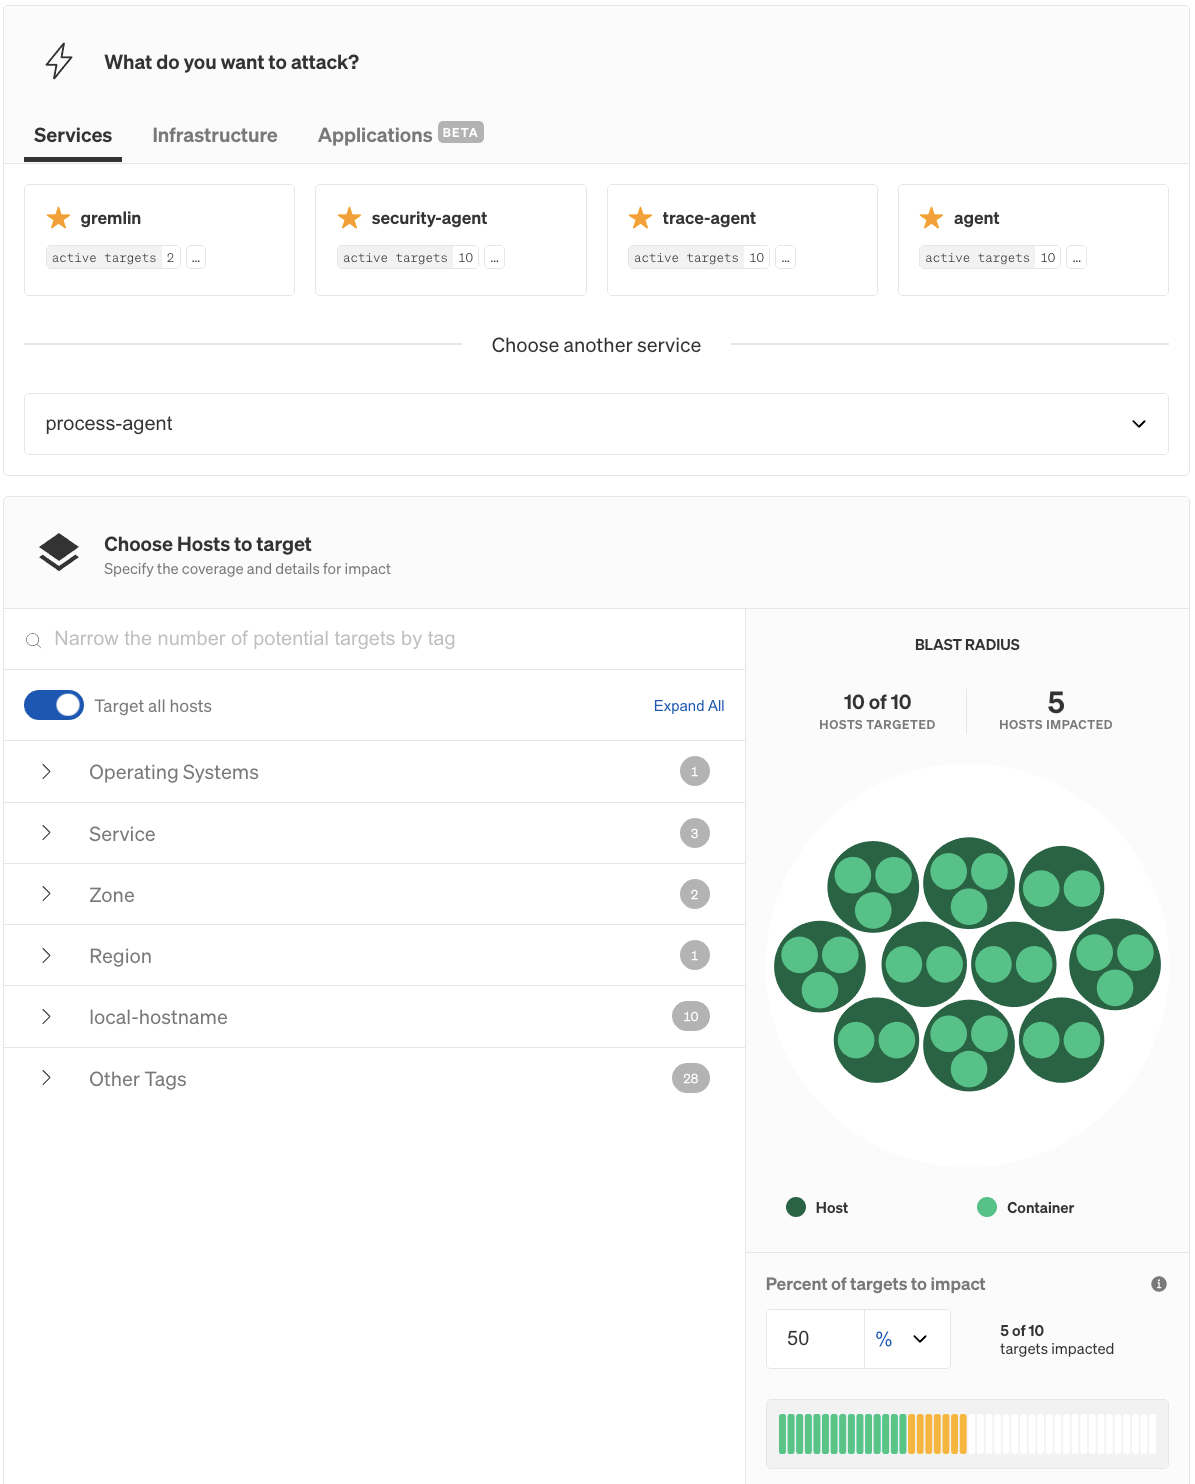
A service can be attacked via the Attack Service button in the service details page. This will bring you directly into the ad-hoc attack workflow with the specific service selected. Here you can refine the blast radius, choose an attack and set magnitude of impact.
Rerunning an attack
Once an attack is ran on a Service you can rerun the same attack from the activity feed. This enables quick attacks with modifications of the blast radius and impact.
Attacking a specific target
You can attack a specific target by opening the Targets tab from the service details page, then clicking Attack Target.
Selecting services from an ad-hoc attack
Services can be targeted when creating an ad-hoc attack. When creating a new attack, select the Services tab and select from the list of starred services, or use the dropdown menu.
FAQ
Q: How often are services discovered?
A: Gremlin currently discovers services once every hour.
Q: How often are characteristics of an existing service discovered and/or modified?
A: Gremlin currently discovers and/or modifies once every hour.
Q: How often are targets resolved to an existing service?
A: Gremlin resolves targets instantly, as soon as they change on a service. If a new pod is registered with the control plane, it’s immediately registered as a target to a service.
Q: How often does Gremlin associate pods, containers and hosts with existing services?
A: Every 30 seconds.