Gremlin helps teams proactively improve the reliability of their systems by running chaos experiments on infrastructure including hosts, containers, and Kubernetes clusters. But as microservice-based architectures and automated cloud platforms become the norm, engineers are shifting their focus from managing infrastructure to managing services. In order to keep these services as resilient as possible, they need tools that can help them find failure modes, reduce incidents, and improve availability.
Today, Gremlin is excited to announce the launch of Services Discovery. Services Discovery automatically detects the services running in your environment and presents them as a new target for running chaos experiments. Now, you can run experiments on distributed services in a single click without having to select each host the service is running on, or use complex tagging systems to tag hosts.
Gain comprehensive visibility into your services
Tracking services in a modern environment creates layers of complexity that are difficult and time-consuming to manage, especially in a dynamic environment. Gremlin provides a complete, up-to-date view of your services along with their operational metadata. This includes port numbers, process names, and the number of active targets the service is running on. You can favorite services that are important to you and your team, or ignore services that are outside of your team’s purview. This way, you always have visibility into your most relevant services.
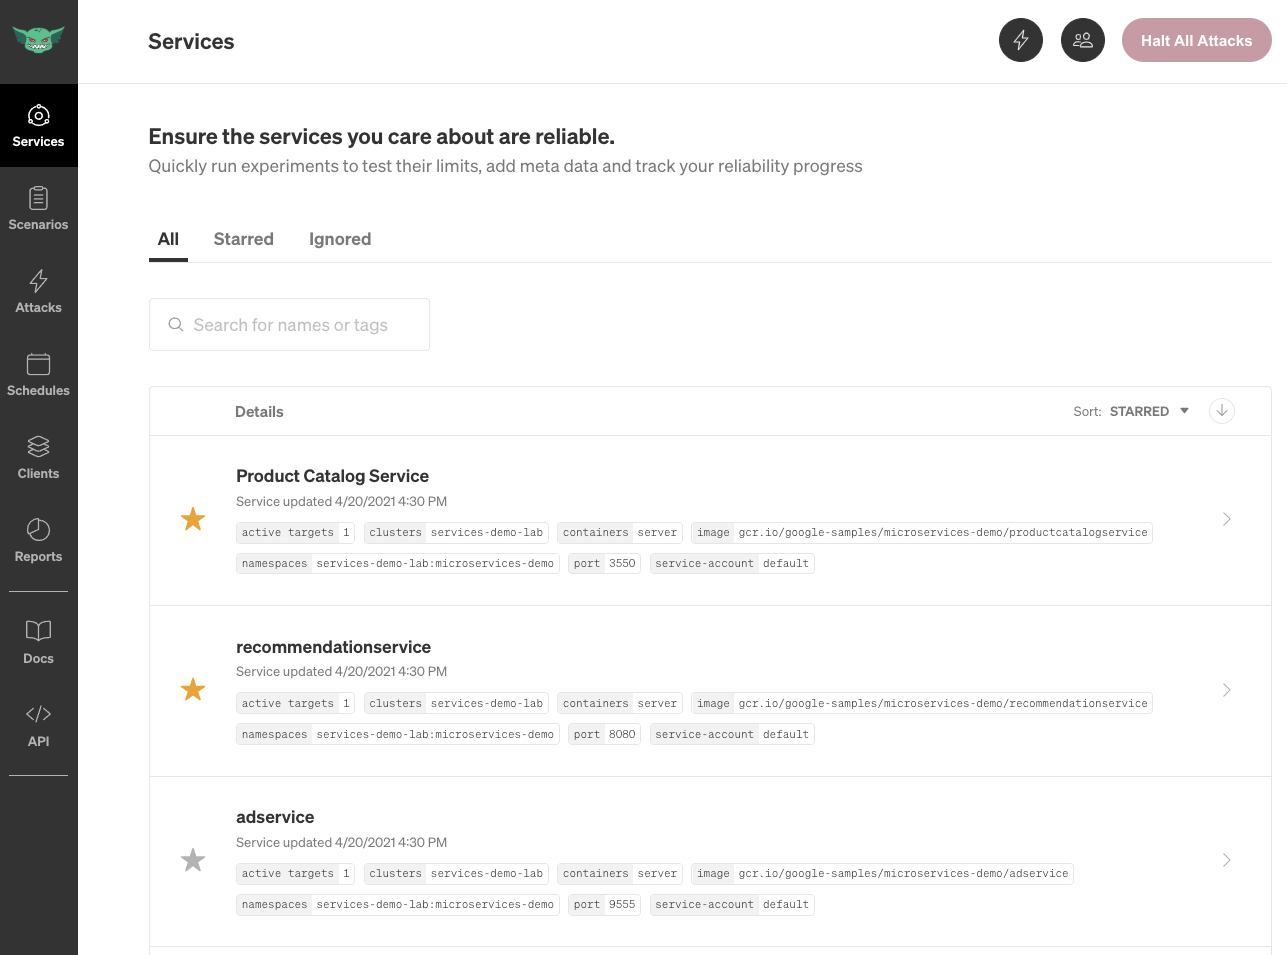
Precisely target and test your services
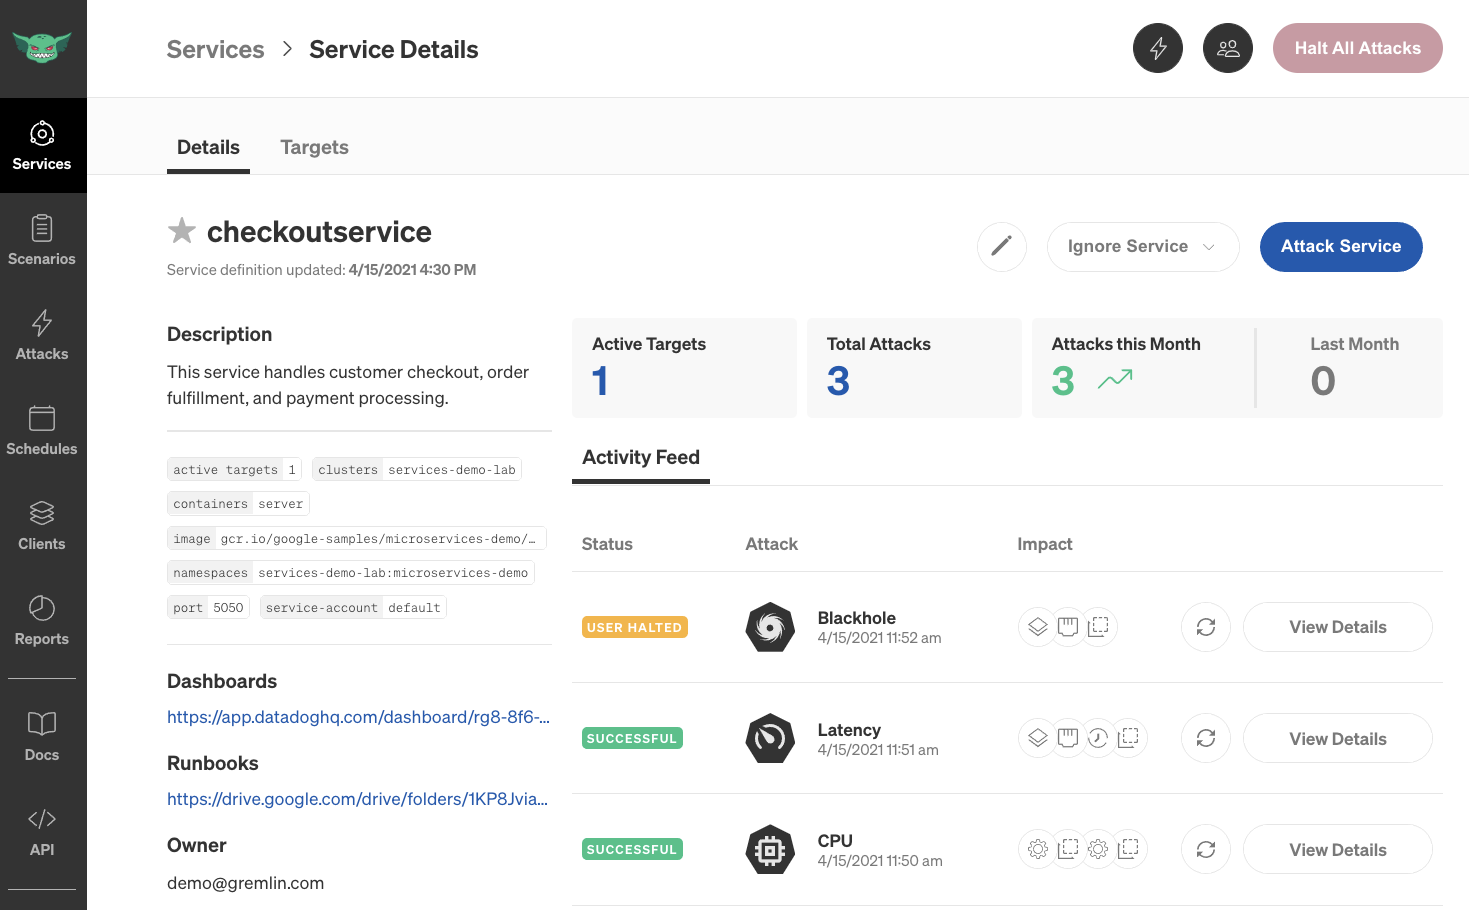
Services Discovery helps you attack smarter. Gremlin automatically detects each service’s name, the system(s) that it’s running on, the network port that it communicates over, and the process name for easy identification. In addition, you can add detailed information about each service in the all new Service Details page. Add a description explaining what each service does, assign an owner, and link directly to monitoring dashboards and incident response runbooks. Make more informed decisions and always be prepared before running an experiment.
When you’re ready to run a chaos experiment, simply click the Attack Service button. Gremlin automatically selects the systems your service is running on. This gives you the ability to precisely isolate and target your chaos experiments and reduce your blast radius.
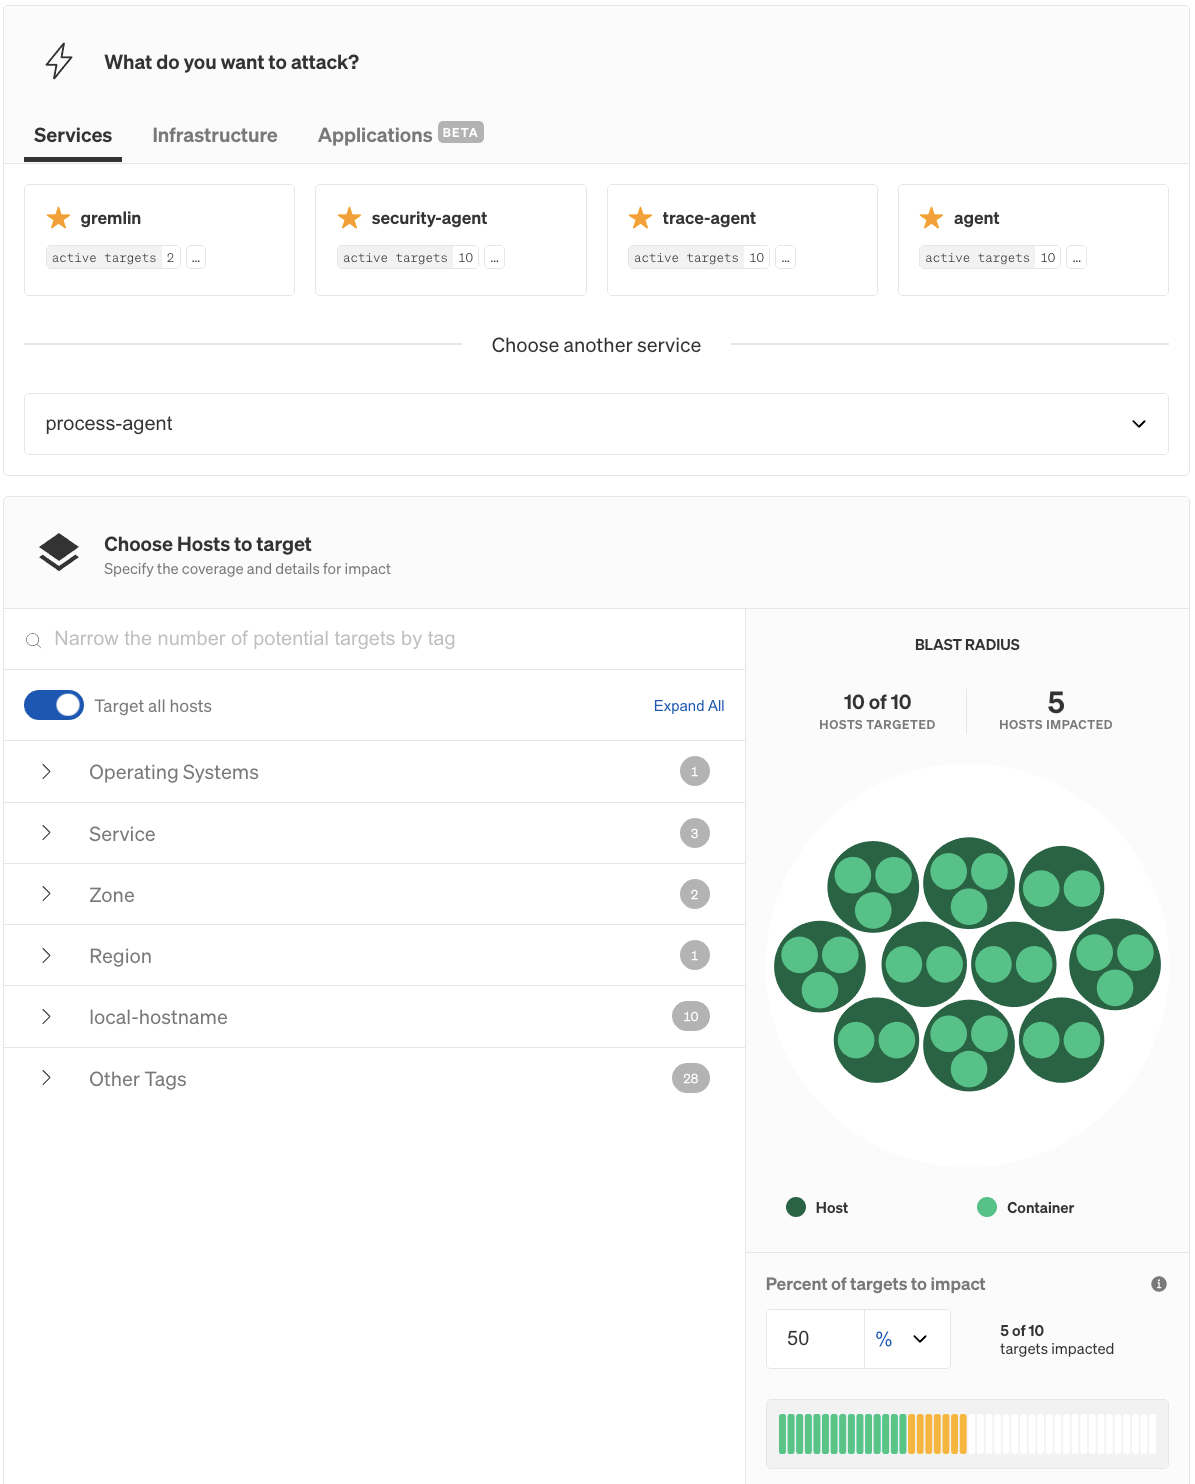
Track your reliability practice
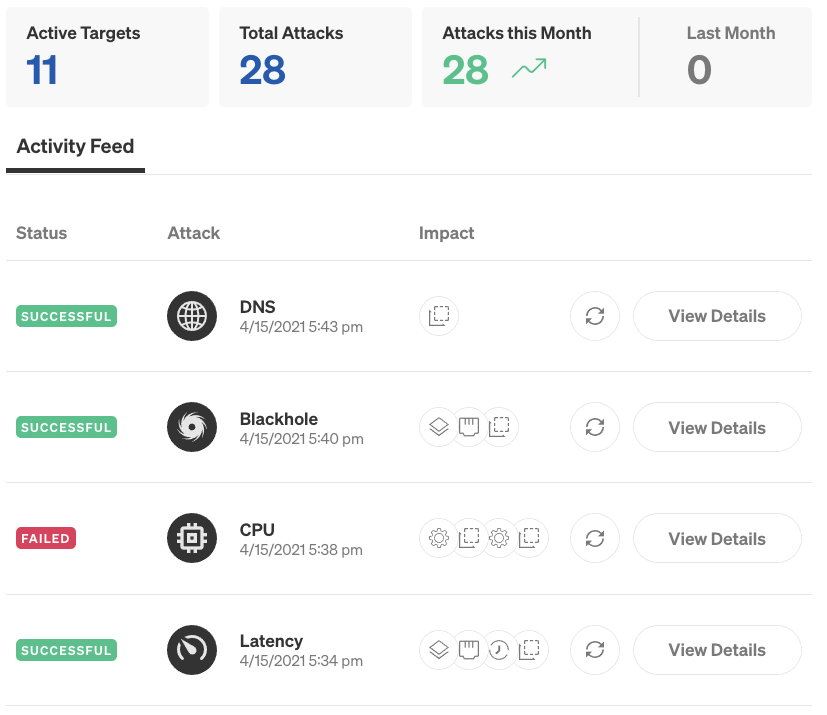
Services Discovery shows you a complete history of experiments performed on each service. Easily see a history of experiments, identify gaps, and prioritize services that need additional testing. See your month-over-month Gremlin activity, and easily re-run successful attacks to avoid regressions and ensure your coverage is up-to-date.
By linking to your monitoring and observability dashboards, service documentation, and incident response runbooks, you can now make Gremlin your go-to-resource for everything related to the reliability of your services.
Services Discovery is one of the most exciting new additions to Gremlin's toolkit! In a micro-services world, it just makes sense to tie chaos experiments and their outcomes to the context of an individual service. It allows for easy exploration of past activity and provides a homepage for teams to start their reliability journey. It's my first stop when I load up Gremlin! Love it!
Watch a complete walkthrough of Services Discovery, from discovering your services to running your first attack:
Start improving your service reliability today
Services Discovery is available for free to all Gremlin users. If you’re an existing Gremlin user, see our documentation to learn how to enable Services Discovery, or follow our guided tutorial. If you’re new to Gremlin, learn how you can start proactively improving reliability today.
